Big 'G' - The Gravitational Constant
1. Introduction
This paper shows why different measurement techniques produce different values for the Gravitational Constant, which is often referred to as ‘Big G’.
A large number of measurements have been made, but for reasons not previously understood, these results are scattered over a relatively wide range of values, that substantially exceed the calculated uncertainty of any one.
The following diagram shows the most reliable results that have been measured since 1982.
(Gravity Big G Measurements NIST - Cavendish experiment - Wikipedia.)
The majority of the measurements overlap the vertical grey strip up the middle. This strip identifies the results that have been adopted by the ‘Committee on Data for Science and Technology’ (‘CODATA’), as the ‘most probably correct’.
However, given the uncertainty of the whole set, two other groups of results should be considered as possible contenders. These predict a value for Big G that totally contradicts those highlighted in the ‘grey line’;
-
Results on the left of the main group, which could be centred on the vertical line at 6.6724. It would include all but one of the results to the left of the grey strip, and
-
Results to the right of the main group. This includes the two results taken by the same team and shown on the right of the grey strip.
2. A possible Problem with these Results.
The problem is that, most authors have NOT followed the rules specified by Newton in his ‘Principia’.
The value of ‘Big G’ is the constant ‘G’ that contributes to the magnitude of the gravitational force ‘F’ when two spherical masses, ‘m1‘ and ‘m2‘ are placed a distance ‘r’ apart:
F=m1 x m2 / (r^2)
Newton’s ‘Principia’, dated 1726, identifies this problem. Book 1 stresses that this formulae given in ‘Section 12 entitled "The attractive forces of spherical bodies", are for spherically-symmetrical bodies only. Only in this case, is the above formula valid.
Newton's ‘Scholium’, at the end of ‘Section 12’, warns that, if either of the bodies m1 or m2) is NOT ‘spherically symmetric', you MUST modify the formulae to suit the more complex shapes.
The application of these rules is much more complicated than spheres or even thin discs in most of the experimental rigs that have been used. Also, the Gravitational Constant work requires significant more complex structures.
2.1 The Cavendish Experiment
In 1798, Henry Cavendish published the results of one of the first experiments aimed at measuring Big G.
He worked with spherical masses, (commonly called 'Test Masses' these days), assumedly
because he had read about Newton's Scholium.
He joined two sphere with a light weight rod to form a 'Dumb-bell', because experience has that the paired bodies (a dumbbell) provide more reliable results.
He placed larger movable sperical balls (commonly called 'Source Masses') at suitable positions
to enable him to measure the rotation of the Dumb-bell.
However, since then, one significant change has occurred. Spheres have been replaced by bodies that can be more accurately made and measured; (cylinders in most cases).
There is only one paper, that I have read, which actually responds to Newton's warning, although, even then withot acknowledging it.
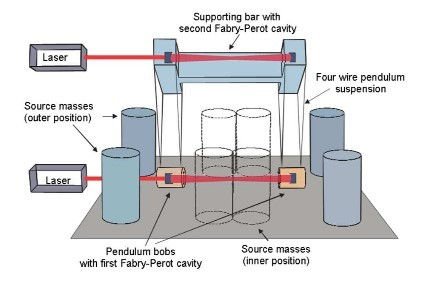
2.2 Parks & Faller
In 2010, Parks and Faller produced a very successful
set of results. Their experimental rig is both simple
and reliable. In order to give an example as a reference,
the following diagram shows it key features.
However they do use cylinders and need to apply
Newton's Scholoium to calculate the gravitational forces.
Experience (see Dark Matter section on this WEP site)
shows the possibility of a significant reduction of a factor
of up to 5 or 6, when calculating the force of gravity
for galactic bodies.
In this paper, the authors have used methods as described in followed methods described by . Chen and Cook [10]. Parks et al seem to have followed the guidance of this texr fairly closely. They have described their calculations in what appears to be a very sound approach for any interacting forces. However, they then complete their study with a formula (13.1) that is very reminiscent of th the calculations carried out by Feng and Gallo, when working on Galactic sources. Instead of multiplying m1 by m2, they do a two dimensional integration between the two. This is the same change that Feng and Gallow [??] used when making the same correction, which then meets Newtons warning; they integrate the forces between individual bits of one object and the individual bits of the other object; (using the simple multiplication is only possible if the two objects are both spherically symetric.
However, in this case, the 'Test Masses' (or 'Pendulum Blobs') are very small compared with the Source Masses and they have proportions that are vaguely spherical. Hence, in the integrations, the integration over these Test Masses could almost be considered as the product of an integration over just the test mass times the mass of the 'Test Mass'. Hence, I would expect that this product will be relatively small. (See discussion on Quinn et al' below to see the implication of this approximation.
However, the integration across the 'Source Masses' is critical. Without repeating their calculations in detail it is impossible to say how large the reduced force is, but I can accept that it could be sufficient to drop the reported from somewhere in the grey band to the quoted value 6.672,34.
The next section in this paper examines the mechanism of the other measurements of Big G
-
Rosi et al only use spherical masses and so do NOT need any integrations.
-
Quinn et all have significant cyliders as both Source and Test Masses, and I suspect that they would require changes of twice or more of the change in this paper.
-
The two oldest projects used only spherical bodies, and will overlap the result of this paper.
-
The remainders have results that are either in or close to 'grey band' in the CODATA diagram all seem to have at least one of the Masses that is a large cylinder.
The remainder of this paper, examines the published documents to confirm or otherwise, the above deductions. It is NOT possible to repeat the calculations without detailed physical measurements, but it may be possible to predict the possible correct version of the CODATA diagram.
3 Analysis of Published Results
Newman et al
TBD
Rosi et al [Prevedeli et al]]
Their 'test mass' is a 'cold' atom. This is sufficiently small that it can be regarded as a 'point particle', particularly in comparision with their 'source masses',
Their 'source mass' is two bundles of 12 tunsten cylinders that effectively appear to be one large cylinder with a hole down the middle so that the atoms can fall through it. The falling atom really only see the ends and the central holw of these cylindrical structures.
One of the first concerns is that they quote Newton's force equation, with two masses as just products of one another. This suggests that they have NOT included the 'integration' over the source mass.
However, they use an 'atom interferometers' and two 'source masses' which can be either immediately one above the other or spaced apart by the wavelength . They seem to say that they can then correct for the lack of integration normally needed; the integration is automatically carried out by the movement of the source masses and the interferometered wave.
This is beyond my understanding, and I have no understanding of interefometry. I think it means that they treat the cylinders in such a specific way that problems others experiemce do not occur.
(Any assistance or advice will be greatfully acknowledged or shared.)
If this is so, then their result is actually a good representation of the value of Big G. It is in the right ballpark despite the very wide spread of its predicted values.
Quinn et al
This team have built one of the really sophistigated systems using the ?????????? method.
References
Prevedelli, M; Cacciaputi, L; Rosi, G; Sorrentino, F; Tino, G. M.
"Measuring the Newtonian C onstant of gravitatinal G with atomic interferometer";
Phil Trans. R, Soc. A 372. 20140030 http://dx.doi.org/10.1098/rsta'2014.0030
Quinn, T; Speake, C; Parks, H; Davis, R;
"2014 The BIPM measurements of the Gravitation, G.".
Phil Trans.R. Soc. A 372: 20140032 http://dx.doi.org/10.1098/rsta.2014.0032
FoThe possible alternate paths are:
1. If both masses are spherical,
then the correct force will be measured.
One group, 'Rosi et al', have used this approach. By using this approach, they avoid the problems discussed below, but lose the advantage of using cylinders:
Accurate spheres are difficult to make,
It is difficult to get two spheres as close to onanother as two cylinders.
2. If one of the two masses (m1 say) is NOT spherical,
The term ‘m1’ must be replaced by xxxxxxxxxx,
where ρ(r) is the density of ‘m1’ at distance ‘r’ from m2.
3. If neither of the two masses is spherical,
the term ‘m1 x m2’ must be replaced by xxxxxxxxx ,
where ‘ρ(r1)' is the density of ‘m1’ and ‘ρ(r2)' is the density of ‘m2’.
In this case, there is only one research group (Quinn et al) where:
both the attracting bodies are cylinders, BUT this group failed to apply the double integral. Their results appear on the right of the diagram.
Another group (Parks and Failer, corrected for the cylindrical nature of both masses.
They used
a 'large' cylinder for the 'Source' mass
and a 'very small' cylinder as the 'Test' mass
Their result appear on the left of the diagram at close to the same value as Rosi et al.
A the moment, I cant find details of the structure used by Tu et al. Their results seem to be betwee the two groups.
It is the contention of this paper, that if the attracting masses involve ‘non-spherical’ masses, then the associated calculations MUST explicitly involve theory covering such ‘non-spherical masses’, as required by Newton’s Scholium.
The above descriptions describe what I have seen so far; I'm having problems viewing early results because they didn't report on the web and I dont have a good access to a University Library.
I'm currently ignoring the two pre-1999 results.
3. A Pedigogical Model
When working with Galaxies, we were describing a disc as seen by an observer in the the plane of the disk.
In this case,, it is sufficient to model a point sized observer at right angles to the circular plane of the cylinder.
We model this with each of the three horizontal discs,; +1, 0 and -1, drawn vertically on the page as a single point (disc of zero radius) with the observer (Test Mass) +1 units to the right. Hence, the forces between these three discs
(P +1.0)
(P 0.0) (TM 0.1)
(P -1.0)
will calculate the forces, from the three points, to the test Mass (TM).
Because we have reduced the three to single points, the force between each one and the observer varies a 1/2^2.